Internals and Price, SPX, February 20th 2018
OI: PCRs are healthy, with next minus near PCR at 0.8 and average of PCRs at 2.3, both pointing higher. For this week, curve is basically flattening but curve into EOM is still pointing higher as it is the the curve into EOW1-0302. Considering these structures it is likely we have some consolidation with downward bias this week.
Current PCR is 2.270; short term razz is pointing lower too into end of this week, Friday, February 25th, but the same approach applies, and indexes should be ideally higher into EOW1-0302. I will try to price the supports for the consolidation, ut should not be deep, so I think trimming positions aggressively is not recommended.
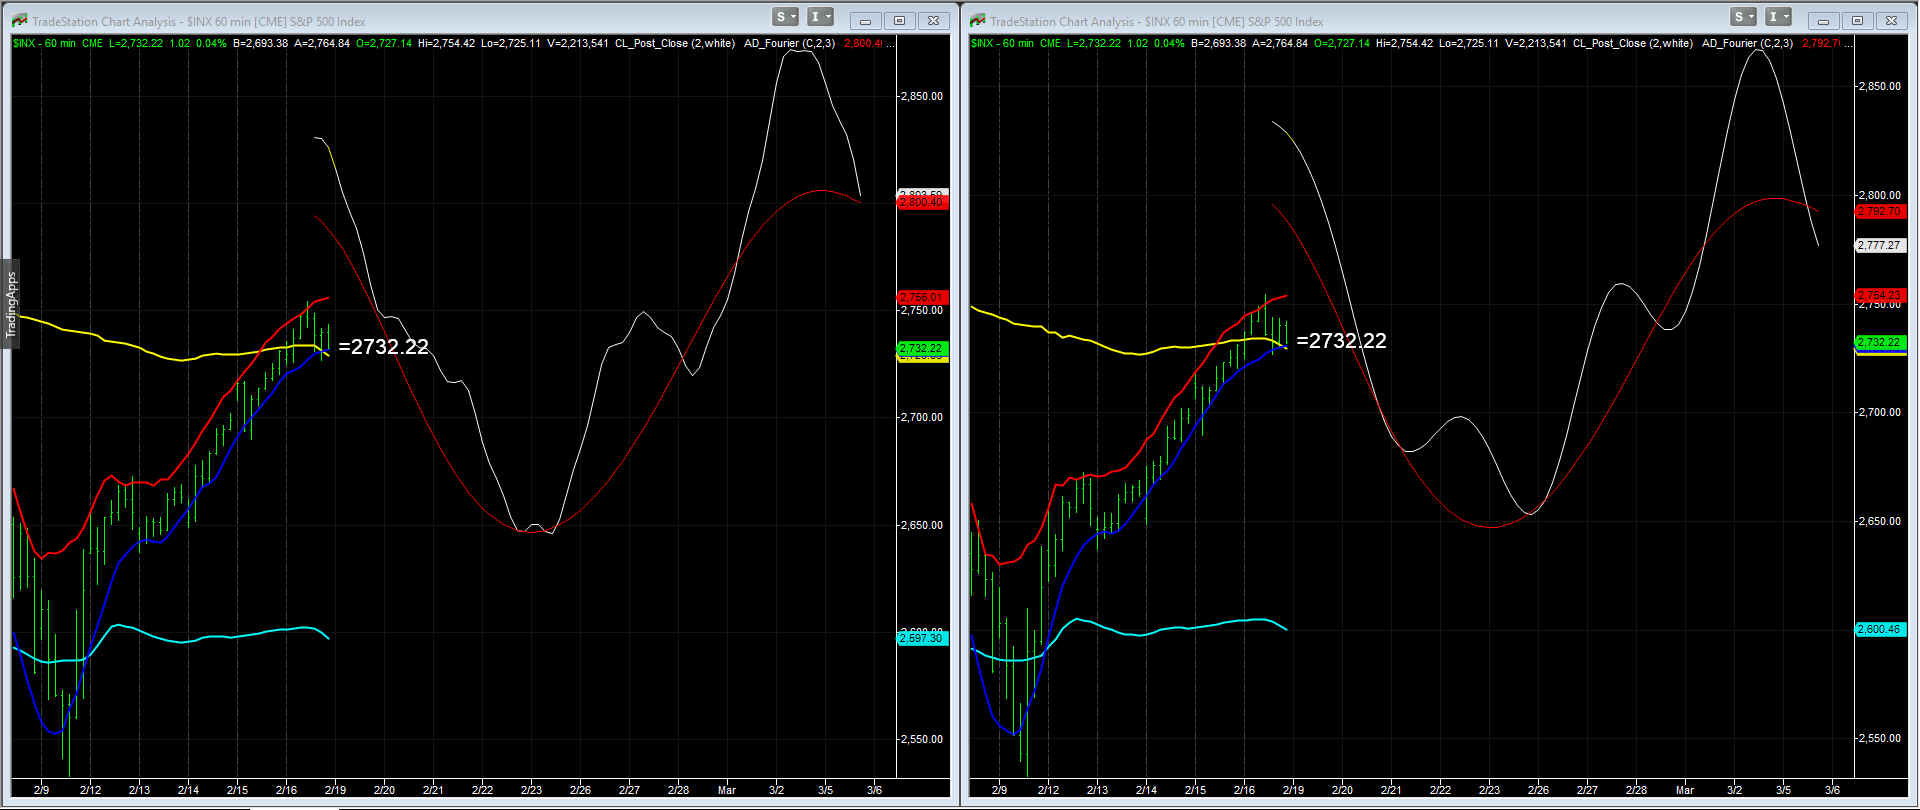
FNG’s Cyclical analysis: Current structure is aligned with Open Interest, as we can see on cyclical chart attached, showing cycles are overbought enough as to allow a higher low into this Friday, but pointing higher into March 5th.
Daily Stoch is still pointing higher on SPX and price is holding the 8 and 55 DEMAs (link). Long term $BPSPX shows we are coming from extreme oversold levels and for what we can see such levels of oversoldness have not failed before, indicating —at least based on $BPSPX— that any projected B wave on SPX should at least retest the all time highs at 2870 area before reversing.
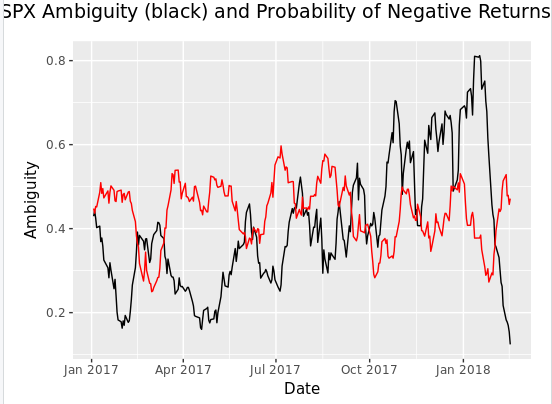
Volatility, I will quote Leov Valencia, the renowned expert in volatility from Gamma Optimizer: February 18th, We have a near term inversion that slowly is going back to normal and the far months have already come down a lot. So that is why I think we have at least a near term period of calm in our hands as the curve has been normalizing very nicely for the last couple of weeks.
Additionally, Ambiguity one of the main indicators he uses continues collapsing now at 0.12. This is why he thinks a massive move up is nearer than a crash event.
Moores’ 2C-P: Reading is at 21.9, low registered on 2/9/18 was 7.00. Values are too low yet as to consider them a threat to further upside on indexes.
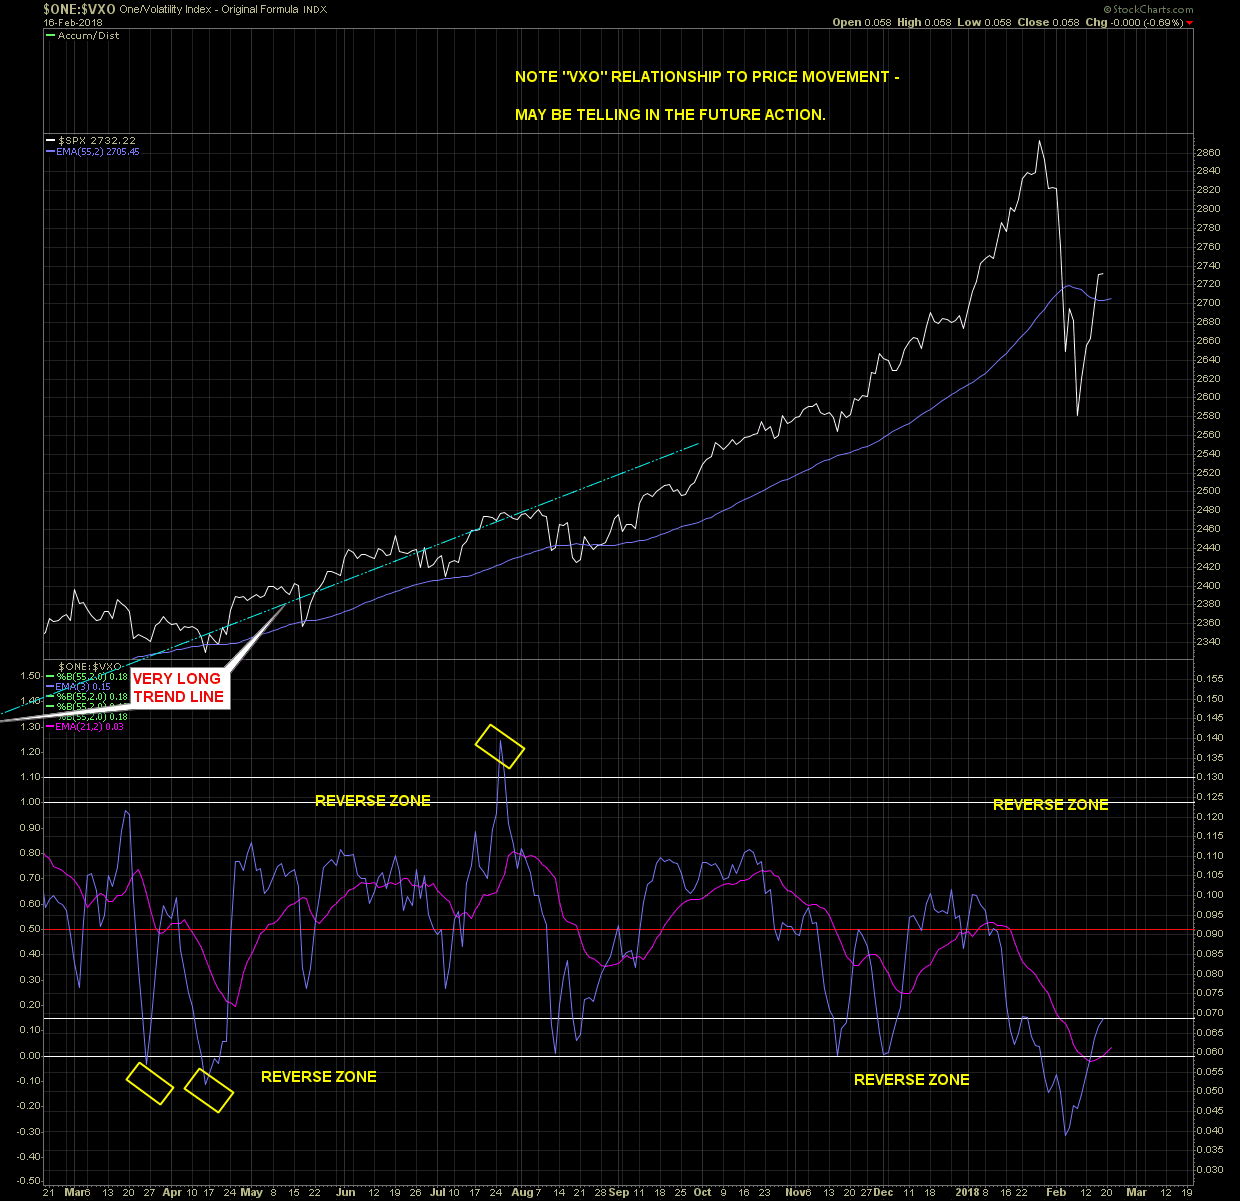
Princely’s $ONE:VXO: Reviewing this chart I think a reading of 0.090 could provide some resistance, and above it we could consider a breakout is occuring.
Current reading at 0.070, so indexes still have room for more upside without a meaningful pullback.
EW analysis:
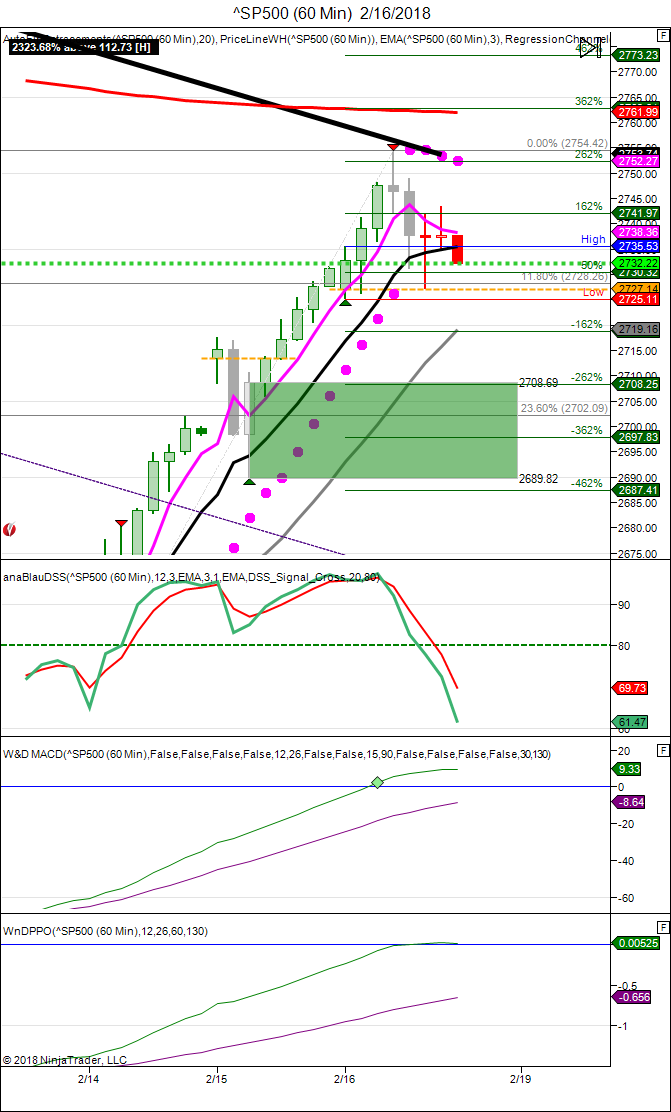
I will start with a hourly chart from Joel Withun, our trading partner; -462 extension on the attached hourly chart, is 2687.41; GFG extends from 2708.69 to 2689.82. Initially, these are the levels that should be broken in order to consider a major downturn is starting.
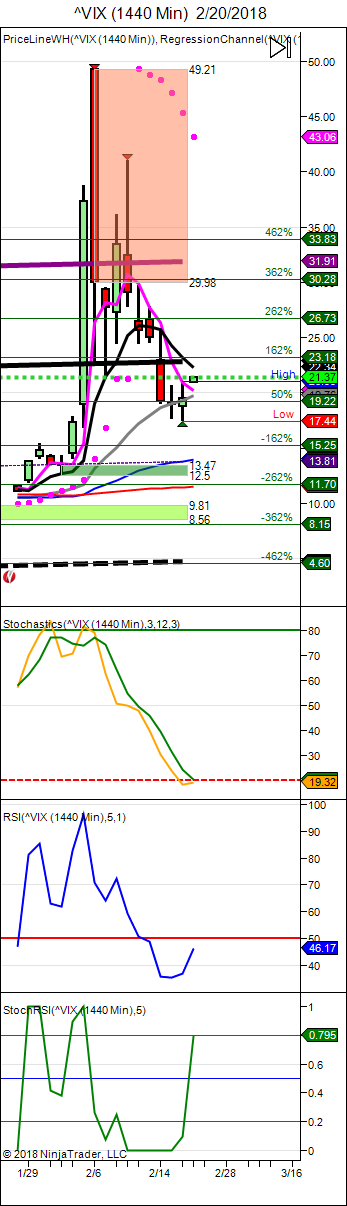
VIX stochastics has rested enough to allow the consolidation we are pricing this week, but price needs to break some levels to assume bearish parameters out of our most aggressive projections.
This is the micro chart I have been using since the bottom at 2529.5 (link) ideal extension at 2772.8 support at 2644.9, price is being rejected by 20 DEMA and an average between 2.00 and 2.618 extension at 2753.5, based on this micro price would need to break 2693.8 to consider a pullback to 2644.9 is on track.
Using other approaches (link) market needs to break 2697.3 to assume a major failure is under way; clearly above 2745.2; minimum target should be projected at 2793.2
All in all we can price a pullback for the week and we are sending you the levels to watch in order to assume our conjectures are trumping reality.
See you in Chat Room
SeekingOptions.com