23
DECEMBER, 2016
OPTIONS
RULES
TRADE MANAGEMENT
Welcome back traders for episode 2 of Doodle’s Dogs. And before I go further Happy Holidays to everyone.
Of course Holiday trading is topic by itself but I will simply mention there is often light volume and some end of year window dressing that may lead to some super opportunities. For example, today is 12/23 and during the day I was looking at $TWTR calls in June. They were somewhat interesting. These calls were up during the day even though at the time $TWTR was flat or even down a bit. So, is this because of increased volatility or demand? I don’t know. I do know I want to buy some calls in $TWTR for next year and the sooner the better.
Today, I wanted to discuss a topic called “support.” This is fundamental to my trading because I often will try to sell puts below what I consider a stock’s level of support. Of course, the goal is for them to expire worthless. Some of the most common ways of looking for support levels are to use Simple Moving Averages (SMA) such as the 200sma, 100sma and 50sma on a daily chart. And then extend that to a weekly for longer term support levels. However, what to you do when the stock you are trading is below those levels? Well, I will show you.
Before we go to the charts there is a very specific reason I’m sharing these two charts. I don’t necessarily believe in market manipulation but I do believe the market is “well controlled.” I think there are machines that are programmed to move stocks in various ways. Of course if I knew how they were programmed I would be super rich and retired. But I don’t. Therefore, I can only share with you what I see. Plus, I do think there are machines that battle each other. So you can never be 100% entirely sure who is going to win.

Facebook $FB Chart and the Put Credit Spread Trade
Two Dates 11/14/16 & 12/1/16 – Trade was taken in Chat Room Put Credit Spread
Here are two examples. You can see on the chart on 11/14/16 Facebook probed lower to 113.55 but then closed at 115.08. The second example is 12/1/16 when Facebook went down to 114 and then closed at 115.10. These closes are exactly .02 cents apart? Why? I don’t know but I am using that information to trade against those closes.
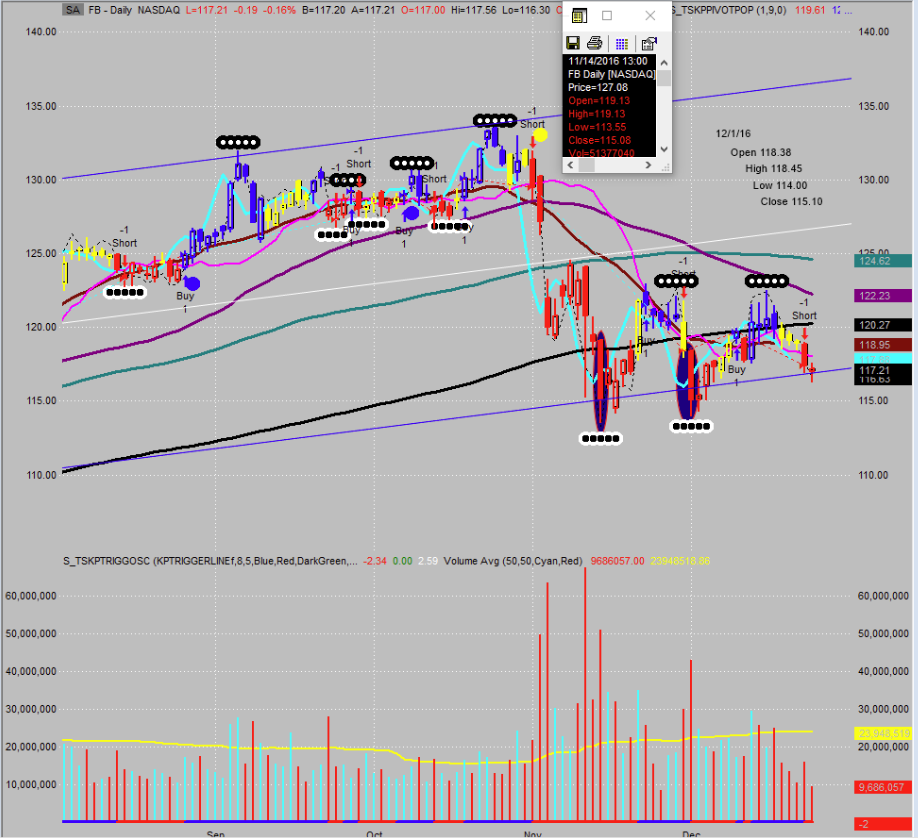
TRADE: December 23, 2016 – Sold the 115 Strike Put and Bought the 109 Strike PUT for the January Week 1 2016 Expiration cycle, with IV: 27%
TARGET: The Normal goal with this type of trade is to close the position worthless (100% profit).
CREDIT: Received $0.45 credit per contract for this trade.
And if $FB breaks 115 I will need to adjust or roll this trade meanwhile I’m hoping that level of “support” holds for now.

Salesforce $CRM Chart and The Put Credit Spread Trade
Trades were taken in Chat Room (Selling Put Credit Spread)
The second example is $CRM. This chart is more of a classic example. On Oct. 5 you had the classic washout example. Notice the large volume spike with 45 million shares which was over 3x average volume. The low on that day was 66.77 and the close was 68.42. You then had a retest on December 2. The low was 66.43 and the close was 68.41. And this was on higher than average volume. Again, this was .01 different on the close the day of the washout. One penny! I have been trading $CRM put spreads against the 69 level. I had a 65/69 put credit spread for .40 cents that expired worthless today and have 65/69 put credit spread for next week that I sold for .56 cents.
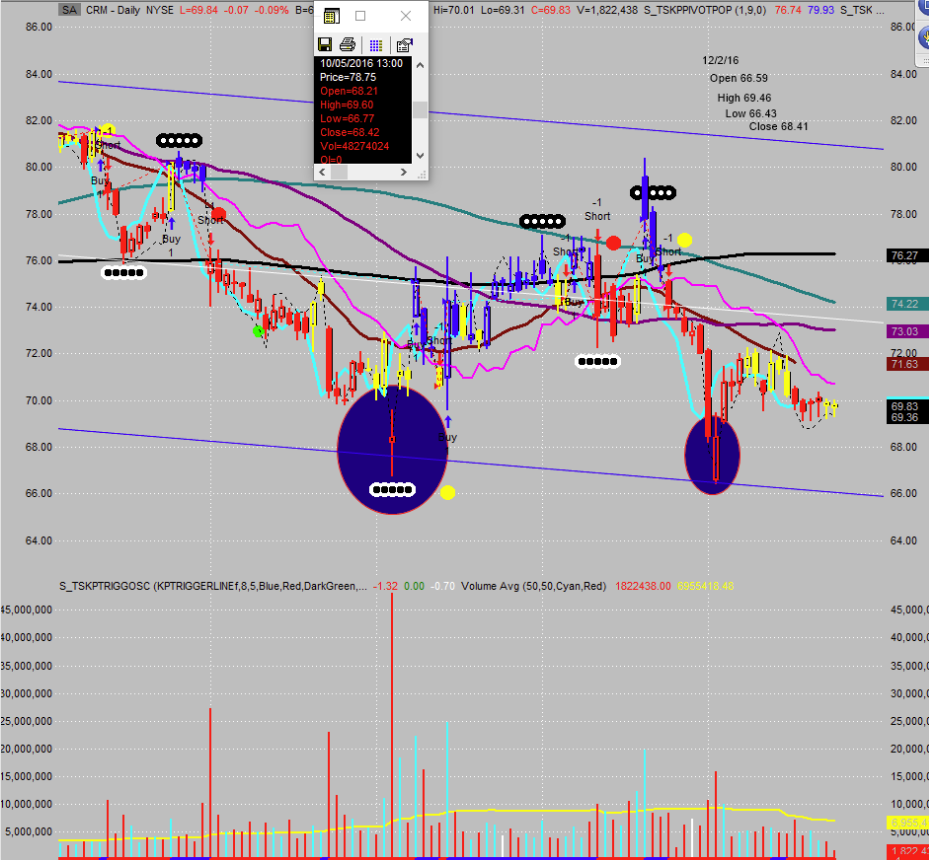
TRADE: December 23, 2016 – Sold the 69 Strike Put and Bought the 65 Strike PUT for the December 30, 2016 Expiration cycle (Weekly), with IV: 18%
TARGET: The Normal goal with this type of trade is to close the position when it reaches over 100% profit (Expire Worthless).
CREDIT: Received $0.56 credit per contract for this trade.
“Learn to take losses. The most important thing in making money is not letting your losses get out of hand.” – Marty Schwartz
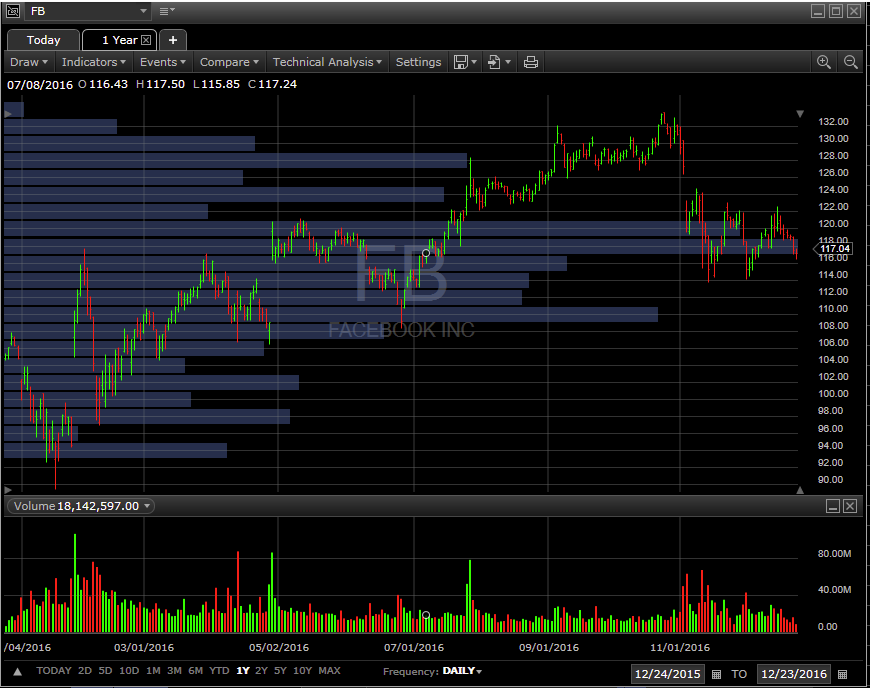
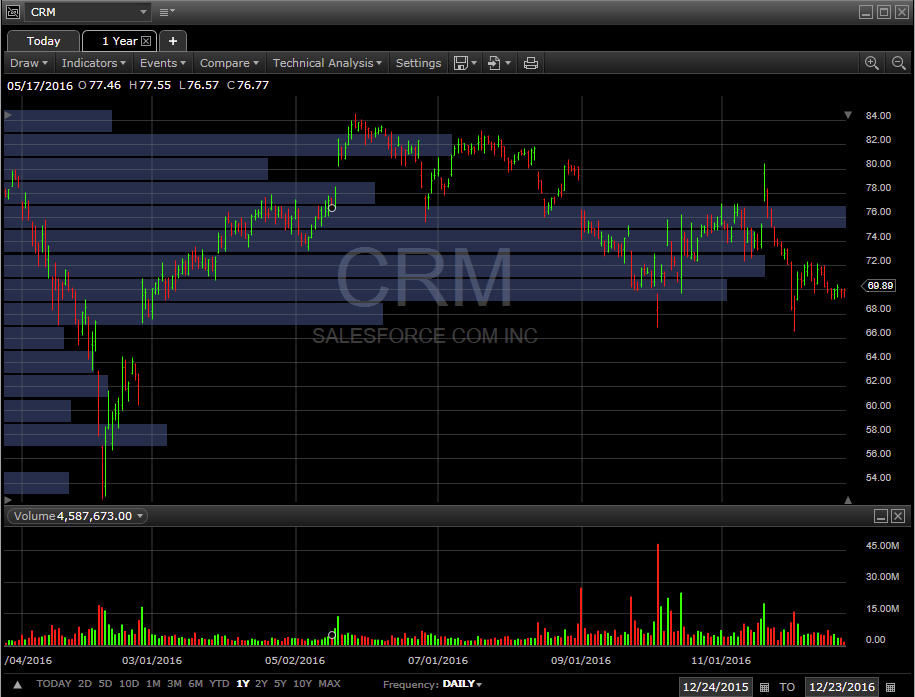
I also pulled some Volume profile charts of $FB and $CRM. What I look for here are areas with very low volume and very high volume. Areas of high volume would be considered the stock’s happy place – where it spends the most time. On Facebook that looks like the 117 level. On Salesforce it looks like there is a lot of volume at the 76 level so I could probably sell calls against that level if there is any premium to be gained. Plus that happens to be the 200 sma on $CRM so a perfect spot for an area of resistance. The chart shows candles reaching to 77 so that would be a more precise spot.
Happy Trading…
Doodles