OPTIONS PINNING

OPTIONS PINNING

09

JANUARY, 2017

OPTIONS PINNING
RULES
TRADE MANAGEMENT

Happy New Year everyone,

In the first blog entry for this year we are going to explore a new type of trade “PINNING”.  I have not done this trade more than 5 times so I certainly don’t consider myself an expert but it is a trade I would like to explore.

In the option world there is a concept called “pinning.”  Normally, pinning takes place on the regular monthly option expiration (not the weeklies).  And my guess is that this type of trade worked better when there was less computer trading with algorithms moving stocks to their destinations vs. the market makers but I will show you what I mean.  The theory behind “pinning” is that the market makers want the stock to land at the strike with the greatest open interest forcing the greatest number of players to close positions on both sides of the trade – the puts and the calls.  So to find a stock where pinning might be in play look for one where there is huge open interest at one strike and very little at other strikes nearby.  Here is an example from $AAPL at the Dec. expiration cycle.

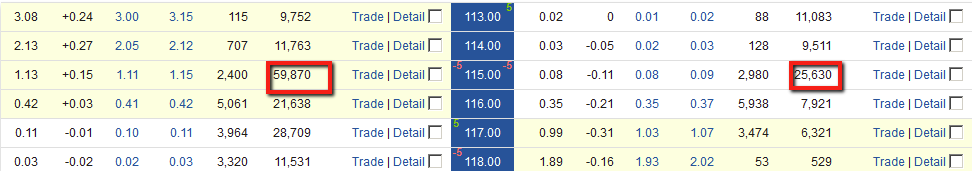
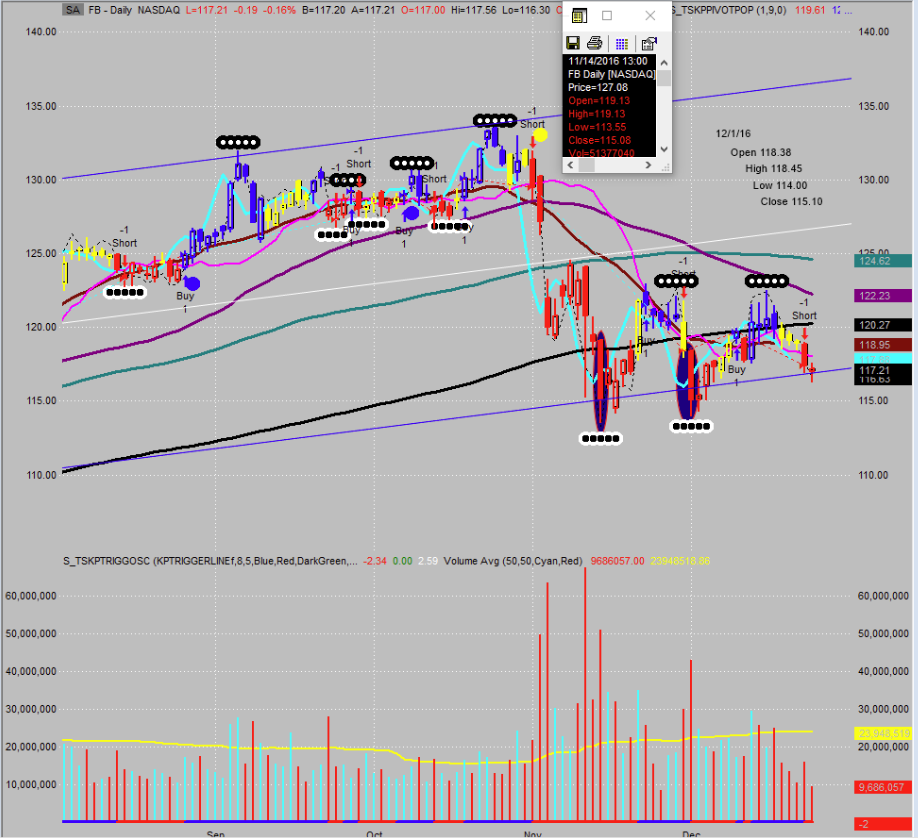
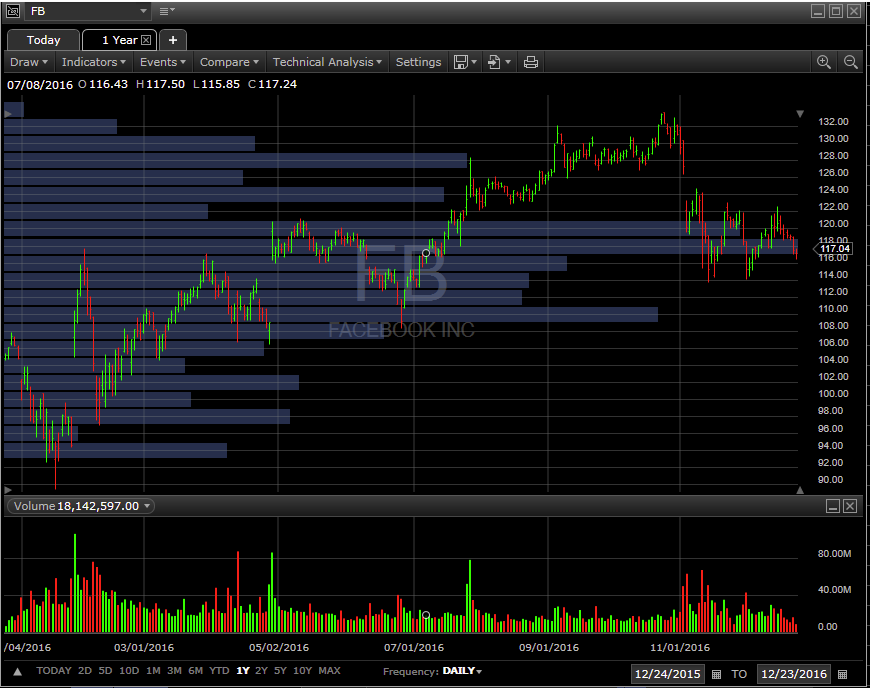
Notice there were 85,500 contracts at the 115 strike and for the other strikes shown nowhere close to that.  Based on that information we decided to sell an Iron fly.  We did this one week before expiration on 12/9.  One of our room members Admiral suggested this trade.  He did a 5 wide spread I did a 2 wide spread.  I do think 5 wide works better.  $AAPL closed on 12/9 at 113.95.    So my Iron fly was 113/115 put credit spread and 115/117 call credit spread for a total of $1.40.  So on a 2 pt. spread I took in $1.40 credit.  My max. loss was .60 cents per contract. The good thing about this type of trade is that it has a good risk/reward ratio.  I was risking .60 to make 1.40.  It may not be a “high” probability type trade but you can be wrong fairly often and still make money.  In this particular example I was wrong but still made money.  $AAPL closed 12/16 at 115.97.  So I had to buy to close the short calls for about .95 cents.  The end result was that I made $.45 cents per contract.  Not bad considering it didn’t pin at 115.

TESLA Pinning

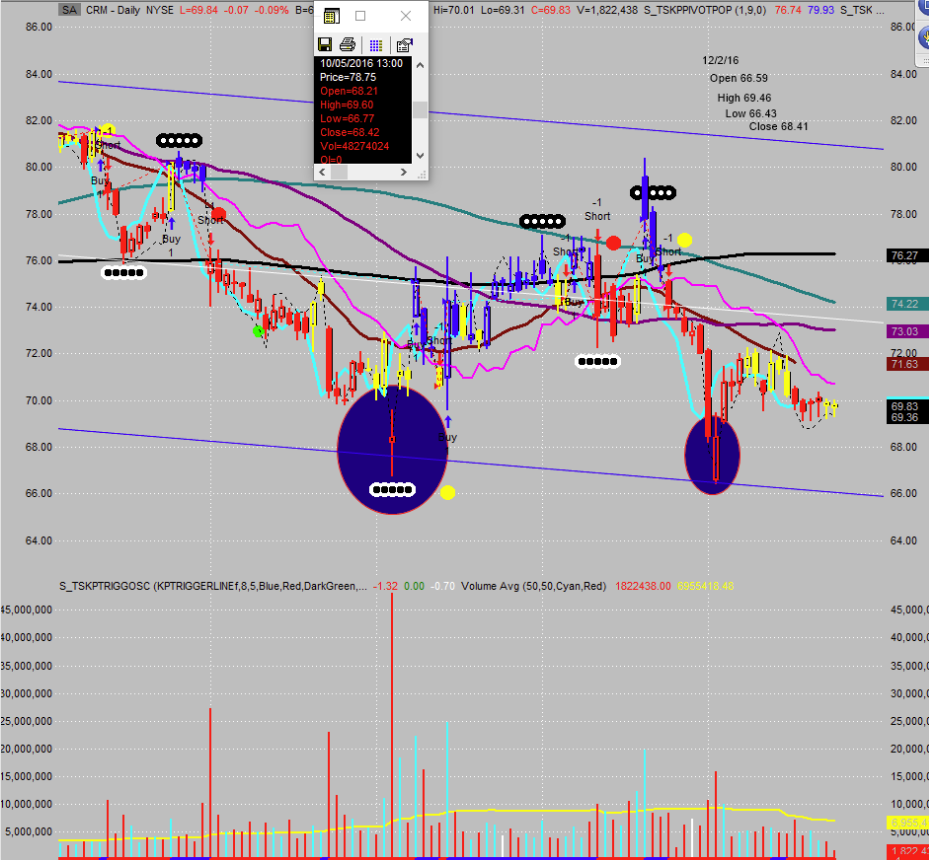
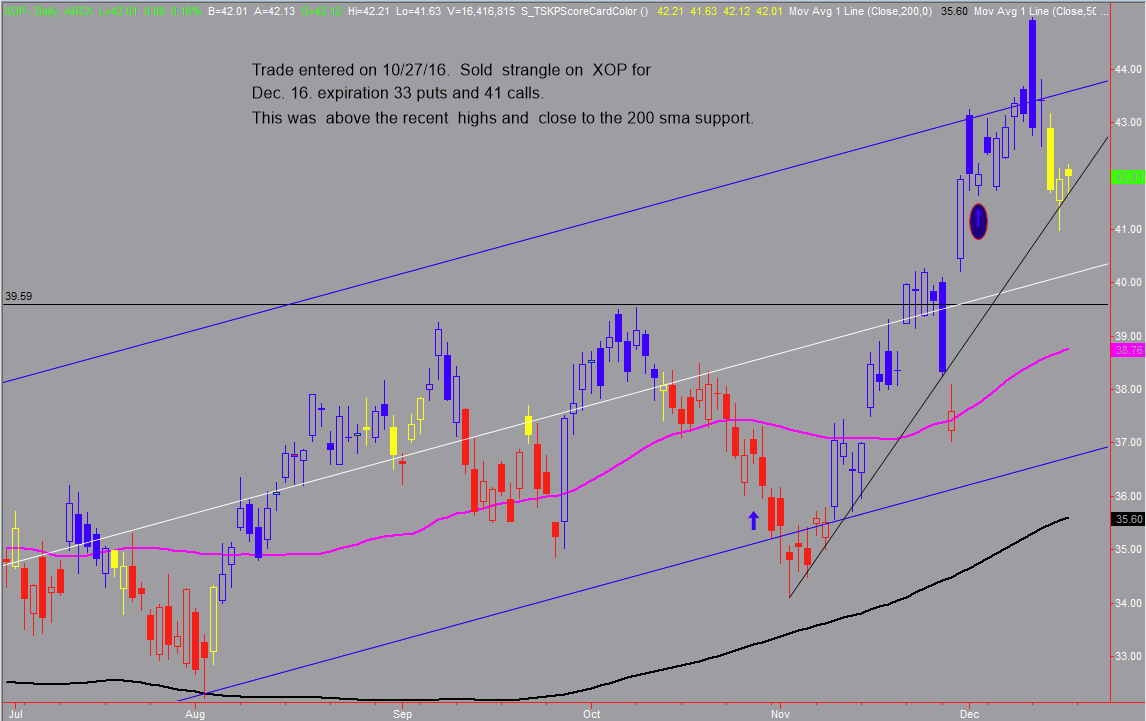
TESLA $TSLA Chart and the “PINNING” Trade

We also tried a pin trade on $TSLA at the 200 strike for the same expiration.  So we sold the 195/200 put credit spread and the 200/205 call credit spread. I received approx. $3.00 for this.
We did this the day before expiration. So market exposure was 24 hours!  This is terrific!!!
Again, we were wrong and $TSLA didn’t pin it closed at 202.49.  But again, I made some money.  Here are the results.

$JPM was the third trade and again it was done the day before expiration.  Admiral simply did a call credit spread and $JPM did pin and he kept the majority of his credit.

Market conditions when we were doing these trades were pretty ideal for “PINNING” conditions.  It was basically a quiet low volume type of market with no market moving reports coming out the day of expiration.
I have also tried a couple of SPX pinning type trades.  One was a 5 pt. spread where I was risking .50 to make 4.50.  It didn’t work but it was worth a shot.  This was for the last trading day of the year and I was hoping for a pin at 2250.  SPX did not comply.
We currently have a GDX pinning trade on for Jan. expiration. This is what we saw.  On 12/23 we saw the Open Interest on the 20 strike on GDX in Jan. simply swell on both sides.  This is the $GDX chart.

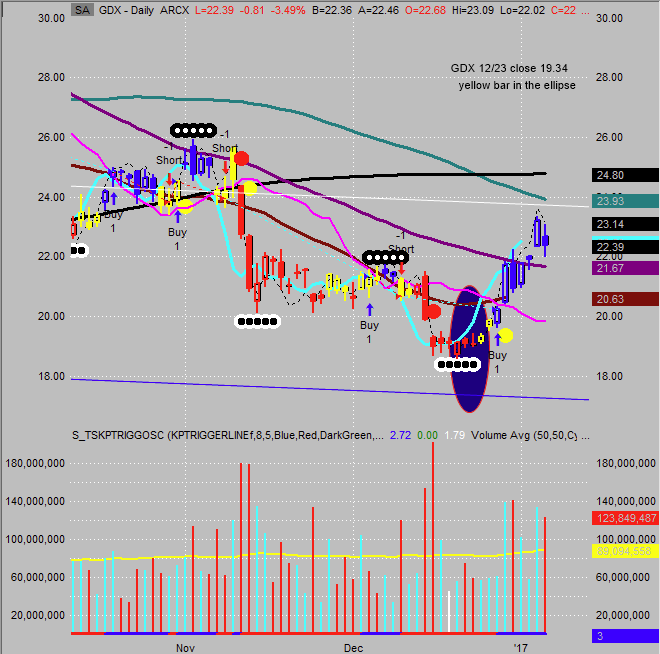
This was the $GDX Option Chain on 12/23/2016

GDX Options Chain for 23/12/2016

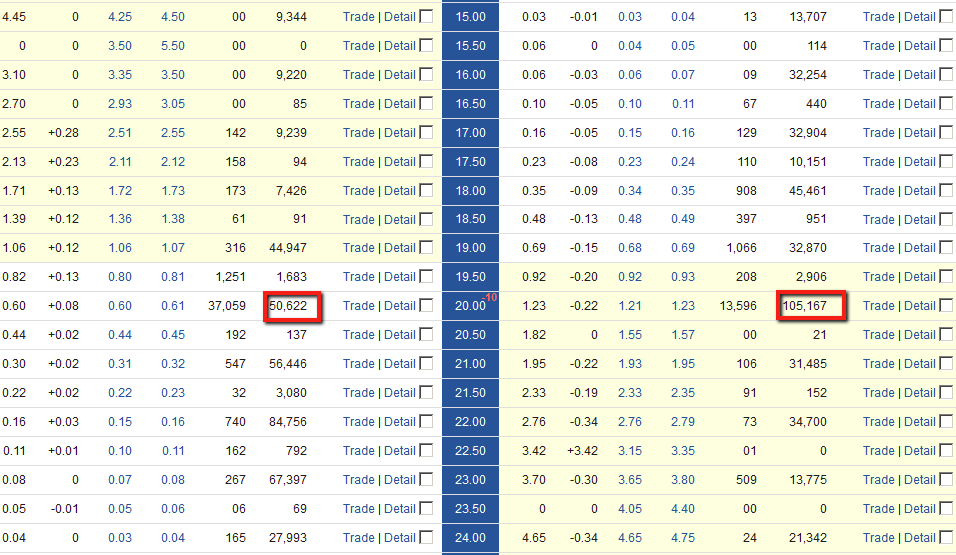
It traded 50,000 contracts at that strike on that day.  So we did an Iron Fly.  We sold a 18/20 put credit spread and a 20/22 call credit spread.  I received approx. $1.27 including commissions.  This trade is currently under water because GDX overshot to the upside.  However, there is still time for GDX to come back in and there is still time to adjust.  If I were to adjust I would probably sell a higher strike put and take in more credit and then roll the put if I needed to.  Right now, I’m waiting.

In general, pinning trades are not really chart based trades but trades based more on what you see in the option chain – large volume, unusual activity.  However, that said, if the stock is sitting on a 200 day moving average or a 50 simple moving average is nearby or the stock is close to a nice round number like 100 or 200 that might lend credence to the pinning.

Because of the high risk vs. reward this trade offers I plan to look for more of this type of trade this year.  One word of caution.  You absolutely must close the short strike in the middle if it is ITM or you could be put stock (either short or long).  This is unless the whole spread is blown out ie. past your long strike also then you can let the whole thing go through expiration at the max. loss.

Also, I had heard of “pinning” but hadn’t practiced it for awhile until another trader came to our room and started suggesting the trade.  So thank you Admiral.  I have extra $$ because you shared your ideas.    And for anyone looking for trade ideas or sharing thoughts about trades our room is a great place to find that.  www.seekingoptions.com.  Until next week,

Doodles

“Success consists of going from failure to failure without loss of enthusiasm.”

– Winston Churchill

CHART PRECISION

CHART PRECISION

23

DECEMBER, 2016

OPTIONS
RULES
TRADE MANAGEMENT

Welcome back traders for episode 2 of Doodle’s Dogs.  And before I go further Happy Holidays to everyone.

Of course Holiday trading is topic by itself but I will simply mention there is often light volume and some end of year window dressing that may lead to some super opportunities.  For example, today is 12/23 and during the day I was looking at $TWTR calls in June.  They were somewhat interesting.  These calls were up during the day even though at the time $TWTR was flat or even down a bit.  So, is this because of increased volatility or demand?  I don’t know.  I do know I want to buy some calls in $TWTR for next year and the sooner the better.

Today, I wanted to discuss a topic called “support.”  This is fundamental to my trading because I often will try to sell puts below what I consider a stock’s level of support.  Of course, the goal is for them to expire worthless.  Some of the most common ways of looking for support levels are to use Simple Moving Averages (SMA) such as the 200sma, 100sma and 50sma on a daily chart.  And then extend that to a weekly for longer term support levels.  However, what to you do when the stock you are trading is below those levels?  Well, I will show you.

Before we go to the charts there is a very specific reason I’m sharing these two charts.  I don’t necessarily believe in market manipulation but I do believe the market is “well controlled.”  I think there are machines that are programmed to move stocks in various ways.  Of course if I knew how they were programmed I would be super rich and retired.  But I don’t.  Therefore, I can only share with you what I see.  Plus, I do think there are machines that battle each other.  So you can never be 100% entirely sure who is going to win.

Facebook Trade

Facebook $FB Chart and the Put Credit Spread Trade

Two Dates 11/14/16 & 12/1/16 – Trade was taken in  Chat Room Put Credit Spread

Here are two examples. You can see on the chart on 11/14/16 Facebook probed lower to 113.55 but then closed at 115.08.  The second example is 12/1/16 when Facebook went down to 114 and then closed at 115.10.  These closes are exactly .02 cents apart?  Why?  I don’t know but I am using that information to trade against those closes.


TRADE: December 23, 2016 –  Sold the 115 Strike Put and Bought the 109 Strike PUT for the January Week 1 2016 Expiration cycle,  with IV: 27%

TARGET: The Normal goal with this type of trade is to close the position worthless (100% profit).

CREDIT: Received $0.45 credit per contract for this trade.

And if $FB breaks 115 I will need to adjust or roll this trade meanwhile I’m hoping that level of “support” holds for now.

Salesforce TRADE

Salesforce $CRM Chart and The Put Credit Spread Trade

Trades were taken in  Chat Room (Selling Put Credit Spread)

The second example is $CRM.  This chart is more of a classic example.  On Oct. 5 you had the classic washout example.  Notice the large volume spike with 45 million shares which was over 3x average volume.  The low on that day was 66.77 and the close was 68.42.  You then had a retest on December 2.  The low was 66.43 and the close was 68.41.  And this was on higher than average volume.  Again, this was .01 different on the close the day of the washout.  One penny!  I have been trading $CRM put spreads against the 69 level.  I had a 65/69 put credit spread for .40 cents that expired worthless today and have 65/69 put credit spread for next week that I sold for .56 cents.


TRADE: December 23, 2016 –  Sold the 69 Strike Put and Bought the 65 Strike PUT for the December 30, 2016 Expiration cycle (Weekly),  with IV: 18%

TARGET: The Normal goal with this type of trade is to close the position when it reaches over 100% profit (Expire Worthless).

CREDIT: Received $0.56 credit per contract for this trade.

“Learn to take losses. The most important thing in making money is not letting your losses get out of hand.– Marty Schwartz

I also pulled some Volume profile charts of $FB and $CRM.  What I look for here are areas with very low volume and very high volume.  Areas of high volume would be considered the stock’s happy place –  where it spends the most time.  On Facebook that looks like the 117 level.  On Salesforce it looks like there is a lot of volume at the 76 level so I could probably sell calls against that level if there is any premium to be gained.  Plus that happens to be the 200 sma on $CRM so a perfect spot for an area of resistance.  The chart shows candles reaching to 77 so that would be a more precise spot.

Facebook
Salesforce

Happy Trading…

Doodles

How To Manage a Difficult Option Trade Successfully?

How To Manage a Difficult Option Trade Successfully?

18

DECEMBER, 2016

OPTIONS
Rules
Trade Management

Welcome everyone to a new trading blog we are calling Doodle’s. I am an option trader with 20 years of experience in trading options.

Often you can find a newsletter or a trading room that will help you get into a trade and this is awesome when it works.  But, they aren’t so good at helping you manage a trade that may not have worked as well as you wanted.  So this blog is an attempt to give you some ideas about managing a “difficult” trade.

In general I prefer selling option premium vs. buying it.  So that means I sell calls and puts (trade them short) vs. buying them.  So I normally take a credit from the market vs. paying the market money to put on a trade.

I am part of a group of traders at www.seekingoptions.com over the past 6 years we have  been sharing trade ideas and learn a lot about trade mechanics – i highly recommend joining this group and be part of the club.

Today I will be presenting a trade that I took in one of my accounts, this trade was an idea suggested from another fellow trader. Before I dive into the trade mechanics, I have to address couple of very basic rules with respect to trading options.

  1. If you are trading equities know when the earnings releases are and if this will impact your option trade.
  2. Know When your option expires.  Don’t guess.
  3. I plan to write up a trade once a week to share with everyone on lessons learned

Here is Today’s Trade:

Our first trade was a strangle on $XOP which is an ETF.

Trade was taken in Chat Room

TRADE: On October, 27, 2016 –  I Sold the 33 Strike Put and the 41 Strike Call for the Dec. 16 Expiration cycle,  with IV: 35%

TARGET: The normal goal with this type of trade is to close the position when it reaches 50% profit.

CREDIT: Received $0.95 credit per contract for this trade.

You can see on the chart the 33 level was about where the 200 Simple Moving Average (SMA) was and the 41 was above this year’s high at the time.  $XOP was trading at 36.81.  So this trade seemed reasonable to me.  $XOP is a S & P Oil and Gas Producers ETF in case you aren’t familiar with it.  And the volatility was around 35% at the time we entered this trade so that wasn’t super exciting.

How do you actually make money with this STRANGLE?

One is through time decay and the other is through volatility going down vs. up.  In this case you can see volatility went completely the wrong direction.  It went higher vs. lower.  There was a very short period of time where this trade was up maybe .10 but overall it was in a losing position for most of the past two months.

Doodles Method on STRANGLES!

One thing I have learned with strangles is that I’m usually “right” and it is wrong to exit the trade early.  If I can adjust or add a fly to control risk or just sit on my hands they usually will work in the end.  This is probably more psychologically difficult than “cutting your losers short” but I simply hate losing.  After all, why should oil rally 12-15% or whatever it has done in the last month?  Has the world really changed that much?

I didn’t really get nervous until it broke above my 41 strike on 11/30/16.  This coincided with OPEC announcing a meeting where they were going to cut production and get everyone to agree to that.  This of course caused oil to go even higher.  By 12/2 I could see that XOP wasn’t going to come down so I rolled my 33 puts and sold some 39 puts to take in more premium.  So now I had a 39/41 strangle.  This resulted in me taking in an extra .27 cents per contract

I held these contracts until expiration today on 12/16/16.  During the day XOP dipped below 42 and I was able to close the calls for .80 cents per contract.  Had XOP not pulled back today I was prepared to roll those calls to another expiration or simply take a loss.  In this case I was able to actually make a small profit on this trade because I rolled the puts up and took in more premium, and XOP actually pulled back close to my upper strike.

A trading plan is just words until you act on it.

LESSONS LEARNED:  I probably won’t trade XOP again simply because oil, which is the underlying, is too volatile.  And because of this volatility does not “come in” on this product but stays constantly relatively high.  There are simply too many extrinsic factors affecting oil the commodity which is then reflected in the oil stocks.  Next time I will trade something simpler.  And if you look closely at the volatility chart for XOP where the red arrow is pointing you can see the move higher in volatility which was just a killer for this trade.

TRADE IDEA: If you liked how we managed the above trade, i am looking for about two weeks out maybe longer and sell $GDX 18.50 puts for .50 cents or more.  Or do a put 1 x 2 ratio trade to cut margin.  In this trade you buy 1 contract and then sell 2 at the next strike lower.  (This trade may need to be rolled but GDX will not go to 0).

Trade Details will be Posted in the #Doodles_trade Channel in our Chat Room

Happy Trading…

Doodles